Main Objective
To conductan objective, evidence-
based and transparent FNS situation
analysis for the season, taking into
account the cumulative effect of
previous seasons, and provide
recommendations for possible
response options
5.
Methodology
Review of existingdata
• Current situation
• Briefing Kit
5
Approach
o Checklists
o Initial Briefings
o Transect drives
o Community
interviews
o Review and
analysis of data
6.
Background Information
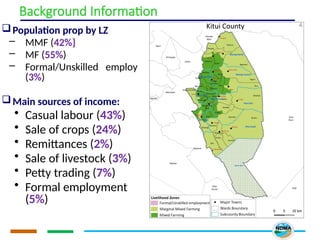
Population propby LZ
– MMF (42%}
– MF (55%)
– Formal/Unskilled employ
(3%)
Main sources of income:
• Casual labour (43%)
• Sale of crops (24%)
• Remittances (2%)
• Sale of livestock (3%)
• Petty trading (7%)
• Formal employment
(5%)
7.
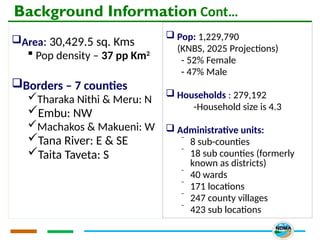
Background Information Cont…
Area:30,429.5 sq. Kms
Pop density – 37 pp Km2
Borders – 7 counties
Tharaka Nithi & Meru: N
Embu: NW
Machakos & Makueni: W
Tana River: E & SE
Taita Taveta: S
Pop: 1,229,790
(KNBS, 2025 Projections)
- 52% Female
- 47% Male
Households : 279,192
-Household size is 4.3
Administrative units:
⁻ 8 sub-counties
⁻ 18 sub counties (formerly
known as districts)
⁻ 40 wards
⁻ 171 locations
⁻ 247 county villages
⁻ 423 sub locations
8.
Current Factors AffectingF&NS
1. Poor rain performance
2. Crop failure/below average crop production
3. Market dependency/high food prices
4. Livestock diseases and mortalities
5. Human wildlife conflicts
6. Insecurity/conflicts
7. Poor surface water recharge
8. Human diseases:
9. Decline in HH coping capacity
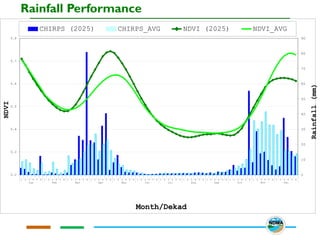
Rainfall Performance
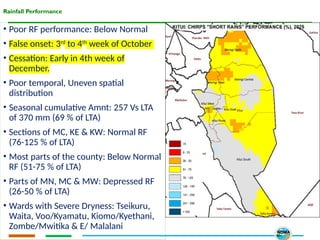
• PoorRF performance: Below Normal
• False onset: 3rd
to 4th
week of October
• Cessation: Early in 4th week of
December.
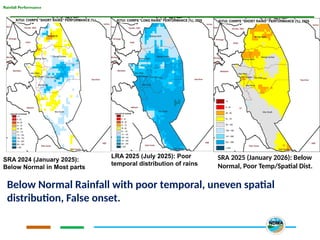
• Poor temporal, Uneven spatial
distribution
• Seasonal cumulative Amnt: 257 Vs LTA
of 370 mm (69 % of LTA)
• Sections of MC, KE & KW: Normal RF
(76-125 % of LTA)
• Most parts of the county: Below Normal
RF (51-75 % of LTA)
• Parts of MN, MC & MW: Depressed RF
(26-50 % of LTA)
• Wards with Severe Dryness: Tseikuru,
Waita, Voo/Kyamatu, Kiomo/Kyethani,
Zombe/Mwitika & E/ Malalani
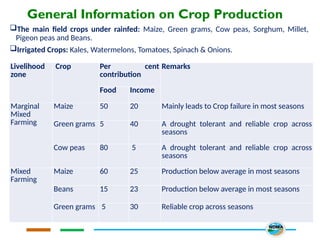
General Information onCrop Production
The main field crops under rainfed: Maize, Green grams, Cow peas, Sorghum, Millet,
Pigeon peas and Beans.
Irrigated Crops: Kales, Watermelons, Tomatoes, Spinach & Onions.
Livelihood
zone
Crop Per cent
contribution
Remarks
Food Income
Marginal
Mixed
Farming
Maize 50 20 Mainly leads to Crop failure in most seasons
Green grams 5 40 A drought tolerant and reliable crop across
seasons
Cow peas 80 5 A drought tolerant and reliable crop across
seasons
Mixed
Farming
Maize 60 25 Production below average in most seasons
Beans 15 23 Production below average in most seasons
Green grams 5 30 Reliable crop across seasons
15.
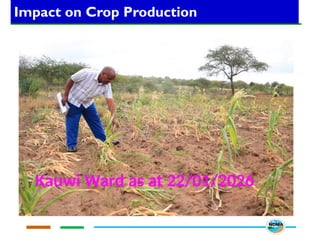
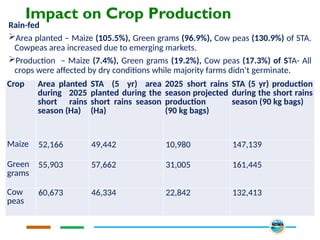
Impact on CropProduction
Rain-fed
Area planted – Maize (105.5%), Green grams (96.9%), Cow peas (130.9%) of STA.
Cowpeas area increased due to emerging markets.
Production – Maize (7.4%), Green grams (19.2%), Cow peas (17.3%) of STA- All
crops were affected by dry conditions while majority farms didn’t germinate.
Crop Area planted
during 2025
short rains
season (Ha)
STA (5 yr) area
planted during the
short rains season
(Ha)
2025 short rains
season projected
production
(90 kg bags)
STA (5 yr) production
during the short rains
season (90 kg bags)
Maize 52,166 49,442 10,980 147,139
Green
grams
55,903 57,662 31,005 161,445
Cow
peas
60,673 46,334 22,842 132,413
16.
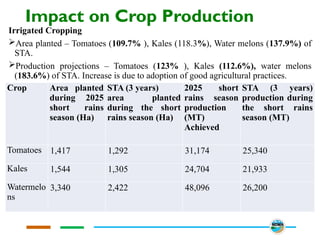
Impact on CropProduction
Irrigated Cropping
Area planted – Tomatoes (109.7% ), Kales (118.3%), Water melons (137.9%) of
STA.
Production projections – Tomatoes (123% ), Kales (112.6%), water melons
(183.6%) of STA. Increase is due to adoption of good agricultural practices.
Crop Area planted
during 2025
short rains
season (Ha)
STA (3 years)
area planted
during the short
rains season (Ha)
2025 short
rains season
production
(MT)
Achieved
STA (3 years)
production during
the short rains
season (MT)
Tomatoes 1,417 1,292 31,174 25,340
Kales 1,544 1,305 24,704 21,933
Watermelo
ns
3,340 2,422 48,096 26,200
17.
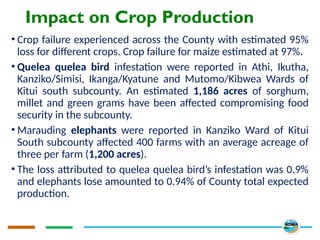
Impact on CropProduction
• Crop failure experienced across the County with estimated 95%
loss for different crops. Crop failure for maize estimated at 97%.
• Quelea quelea bird infestation were reported in Athi, Ikutha,
Kanziko/Simisi, Ikanga/Kyatune and Mutomo/Kibwea Wards of
Kitui south subcounty. An estimated 1,186 acres of sorghum,
millet and green grams have been affected compromising food
security in the subcounty.
• Marauding elephants were reported in Kanziko Ward of Kitui
South subcounty affected 400 farms with an average acreage of
three per farm (1,200 acres).
• The loss attributed to quelea quelea bird’s infestation was 0.9%
and elephants lose amounted to 0.94% of County total expected
production.
18.
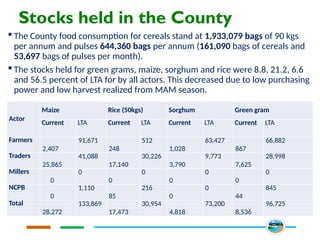
Stocks held inthe County
The County food consumption for cereals stand at 1,933,079 bags of 90 kgs
per annum and pulses 644,360 bags per annum (161,090 bags of cereals and
53,697 bags of pulses per month).
The stocks held for green grams, maize, sorghum and rice were 8.8, 21.2, 6.6
and 56.5 percent of LTA for by all actors. This decreased due to low purchasing
power and low harvest realized from MAM season.
Actor
Maize Rice (50kgs) Sorghum Green gram
Current LTA Current LTA Current LTA Current LTA
Farmers
2,407
91,671
248
512
1,028
63,427
867
66,882
Traders
25,865
41,088
17,140
30,226
3,790
9,773
7,625
28,998
Millers
0
0
0
0
0
0
0
0
NCPB
0
1,110
85
216
0
0
44
845
Total
28,272
133,869
17,473
30,954
4,818
73,200
8,536
96,725
19.
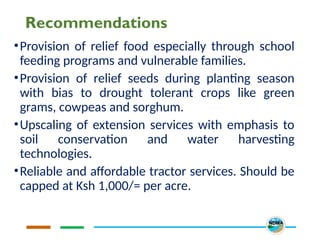
Recommendations
•Provision of relieffood especially through school
feeding programs and vulnerable families.
•Provision of relief seeds during planting season
with bias to drought tolerant crops like green
grams, cowpeas and sorghum.
•Upscaling of extension services with emphasis to
soil conservation and water harvesting
technologies.
•Reliable and affordable tractor services. Should be
capped at Ksh 1,000/= per acre.
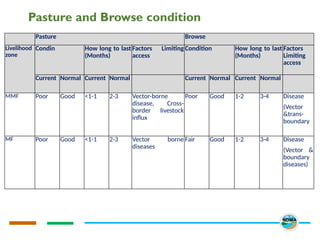
Pasture and Browsecondition
Pasture Browse
Livelihood
zone
Condin How long to last
(Months)
Factors Limiting
access
Condition How long to last
(Months)
Factors
Limiting
access
Current Normal Current Normal Current Normal Current Normal
MMF Poor Good <1-1 2-3 Vector-borne
disease, Cross-
border livestock
influx
Poor Good 1-2 3-4 Disease
(Vector
&trans-
boundary
MF Poor Good <1-1 2-3 Vector borne
diseases
Fair Good 1-2 3-4 Disease
(Vector &
boundary
diseases)
23.
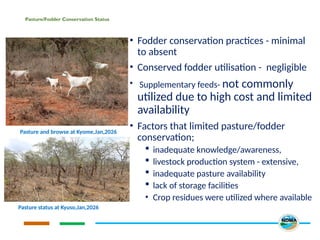
Pasture/Fodder Conservation Status
•Fodder conservation practices - minimal
to absent
• Conserved fodder utilisation - negligible
• Supplementary feeds- not commonly
utilized due to high cost and limited
availability
• Factors that limited pasture/fodder
conservation;
inadequate knowledge/awareness,
livestock production system - extensive,
inadequate pasture availability
lack of storage facilities
• Crop residues were utilized where available
Pasture status at Kyuso,Jan,2026
Pasture and browse at Kyome,Jan,2026
24.
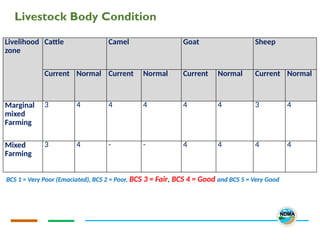
Livestock Body Condition
Livelihood
zone
CattleCamel Goat Sheep
Current Normal Current Normal Current Normal Current Normal
Marginal
mixed
Farming
3 4 4 4 4 4 3 4
Mixed
Farming
3 4 - - 4 4 4 4
BCS 1 = Very Poor (Emaciated), BCS 2 = Poor, BCS 3 = Fair, BCS 4 = Good and BCS 5 = Very Good
25.
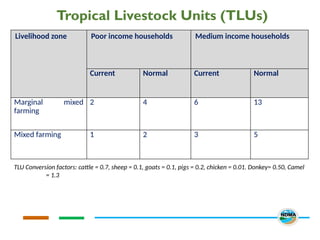
Tropical Livestock Units(TLUs)
Livelihood zone Poor income households Medium income households
Current Normal Current Normal
Marginal mixed
farming
2 4 6 13
Mixed farming 1 2 3 5
TLU Conversion factors: cattle = 0.7, sheep = 0.1, goats = 0.1, pigs = 0.2, chicken = 0.01. Donkey= 0.50, Camel
= 1.3
26.
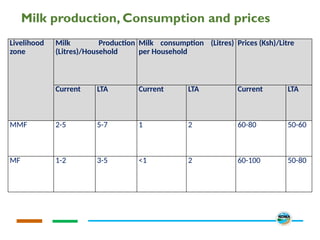
Milk production, Consumptionand prices
Livelihood
zone
Milk Production
(Litres)/Household
Milk consumption (Litres)
per Household
Prices (Ksh)/Litre
Current LTA Current LTA Current LTA
MMF 2-5 5-7 1 2 60-80 50-60
MF 1-2 3-5 <1 2 60-100 50-80
27.
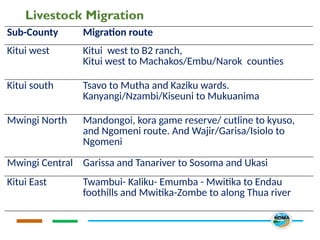
Livestock Migration
Sub-County Migrationroute
Kitui west Kitui west to B2 ranch,
Kitui west to Machakos/Embu/Narok counties
Kitui south Tsavo to Mutha and Kaziku wards.
Kanyangi/Nzambi/Kiseuni to Mukuanima
Mwingi North Mandongoi, kora game reserve/ cutline to kyuso,
and Ngomeni route. And Wajir/Garisa/Isiolo to
Ngomeni
Mwingi Central Garissa and Tanariver to Sosoma and Ukasi
Kitui East Twambui- Kaliku- Emumba - Mwitika to Endau
foothills and Mwitika-Zombe to along Thua river
28.
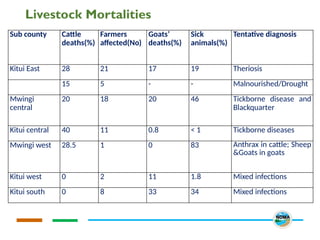
Livestock Mortalities
Sub countyCattle
deaths(%)
Farmers
affected(No)
Goats’
deaths(%)
Sick
animals(%)
Tentative diagnosis
Kitui East 28 21 17 19 Theriosis
15 5 - - Malnourished/Drought
Mwingi
central
20 18 20 46 Tickborne disease and
Blackquarter
Kitui central 40 11 0.8 < 1 Tickborne diseases
Mwingi west 28.5 1 0 83 Anthrax in cattle; Sheep
&Goats in goats
Kitui west 0 2 11 1.8 Mixed infections
Kitui south 0 8 33 34 Mixed infections
29.
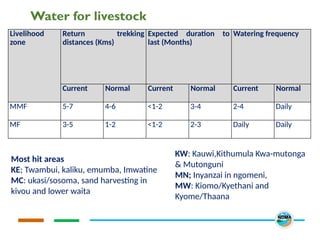
Water for livestock
Livelihood
zone
Returntrekking
distances (Kms)
Expected duration to
last (Months)
Watering frequency
Current Normal Current Normal Current Normal
MMF 5-7 4-6 <1-2 3-4 2-4 Daily
MF 3-5 1-2 <1-2 2-3 Daily Daily
Most hit areas
KE; Twambui, kaliku, emumba, Imwatine
MC: ukasi/sosoma, sand harvesting in
kivou and lower waita
KW: Kauwi,Kithumula Kwa-mutonga
& Mutonguni
MN; Inyanzai in ngomeni,
MW: Kiomo/Kyethani and
Kyome/Thaana
30.
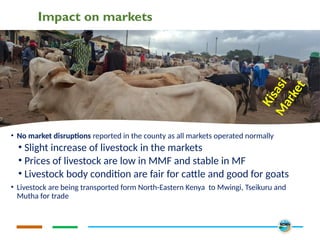
Impact on markets
•No market disruptions reported in the county as all markets operated normally
• Slight increase of livestock in the markets
• Prices of livestock are low in MMF and stable in MF
• Livestock body condition are fair for cattle and good for goats
• Livestock are being transported form North-Eastern Kenya to Mwingi, Tseikuru and
Mutha for trade
K
i
s
a
s
i
M
a
r
k
e
t
31.
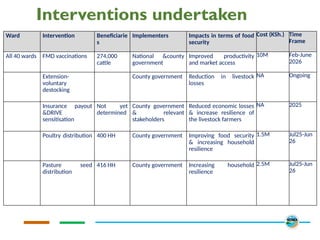
Interventions undertaken
Ward InterventionBeneficiarie
s
Implementers Impacts in terms of food
security
Cost (KSh.) Time
Frame
All 40 wards FMD vaccinations 274,000
cattle
National &county
government
Improved productivity
and market access
10M Feb-June
2026
Extension-
voluntary
destocking
County government Reduction in livestock
losses
NA Ongoing
Insurance payout
&DRIVE
sensitisation
Not yet
determined
County government
& relevant
stakeholders
Reduced economic losses
& increase resilience of
the livestock farmers
NA 2025
Poultry distribution 400 HH County government Improving food security
& increasing household
resilience
1.5M Jul25-Jun
26
Pasture seed
distribution
416 HH County government Increasing household
resilience
2.5M Jul25-Jun
26
32.
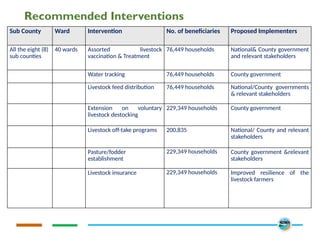
Recommended Interventions
Sub CountyWard Intervention No. of beneficiaries Proposed Implementers
All the eight (8)
sub counties
40 wards Assorted livestock
vaccination & Treatment
76,449 households National& County government
and relevant stakeholders
Water tracking 76,449 households County government
Livestock feed distribution 76,449 households National/County governments
& relevant stakeholders
Extension on voluntary
livestock destocking
229,349 households County government
Livestock off-take programs 200,835 National/ County and relevant
stakeholders
Pasture/fodder
establishment
229,349 households County government &relevant
stakeholders
Livestock insurance 229,349 households Improved resilience of the
livestock farmers
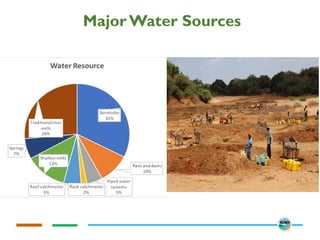
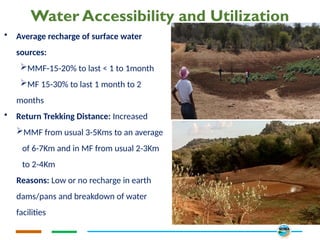
Water Accessibility andUtilization
• Average recharge of surface water
sources:
MMF-15-20% to last < 1 to 1month
MF 15-30% to last 1 month to 2
months
• Return Trekking Distance: Increased
MMF from usual 3-5Kms to an average
of 6-7Km and in MF from usual 2-3Km
to 2-4Km
Reasons: Low or no recharge in earth
dams/pans and breakdown of water
facilities
36.
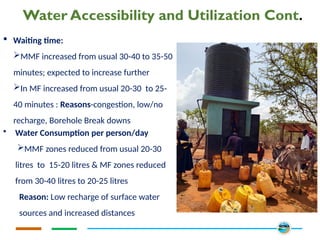
Water Accessibility andUtilization Cont.
Waiting time:
MMF increased from usual 30-40 to 35-50
minutes; expected to increase further
In MF increased from usual 20-30 to 25-
40 minutes : Reasons-congestion, low/no
recharge, Borehole Break downs
• Water Consumption per person/day
MMF zones reduced from usual 20-30
litres to 15-20 litres & MF zones reduced
from 30-40 litres to 20-25 litres
Reason: Low recharge of surface water
sources and increased distances
37.
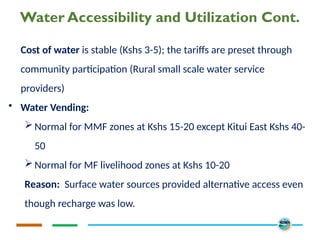
Water Accessibility andUtilization Cont.
Cost of water is stable (Kshs 3-5); the tariffs are preset through
community participation (Rural small scale water service
providers)
• Water Vending:
Normal for MMF zones at Kshs 15-20 except Kitui East Kshs 40-
50
Normal for MF livelihood zones at Kshs 10-20
Reason: Surface water sources provided alternative access even
though recharge was low.
38.
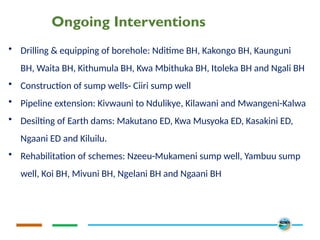
Ongoing Interventions
• Drilling& equipping of borehole: Nditime BH, Kakongo BH, Kaunguni
BH, Waita BH, Kithumula BH, Kwa Mbithuka BH, Itoleka BH and Ngali BH
• Construction of sump wells- Ciiri sump well
• Pipeline extension: Kivwauni to Ndulikye, Kilawani and Mwangeni-Kalwa
• Desilting of Earth dams: Makutano ED, Kwa Musyoka ED, Kasakini ED,
Ngaani ED and Kiluilu.
• Rehabilitation of schemes: Nzeeu-Mukameni sump well, Yambuu sump
well, Koi BH, Mivuni BH, Ngelani BH and Ngaani BH
39.
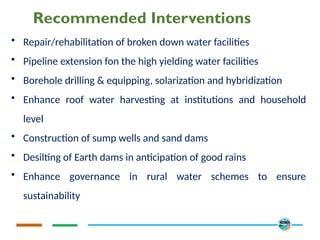
Recommended Interventions
• Repair/rehabilitationof broken down water facilities
• Pipeline extension fon the high yielding water facilities
• Borehole drilling & equipping, solarization and hybridization
• Enhance roof water harvesting at institutions and household
level
• Construction of sump wells and sand dams
• Desilting of Earth dams in anticipation of good rains
• Enhance governance in rural water schemes to ensure
sustainability
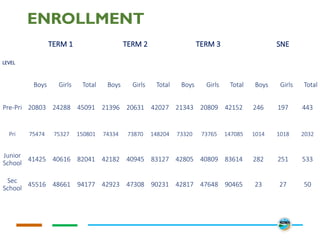
ENROLLMENT
LEVEL
TERM 1 TERM2 TERM 3 SNE
Boys Girls Total Boys Girls Total Boys Girls Total Boys Girls Total
Pre-Pri 20803 24288 45091 21396 20631 42027 21343 20809 42152 246 197 443
Pri 75474 75327 150801 74334 73870 148204 73320 73765 147085 1014 1018 2032
Junior
School
41425 40616 82041 42182 40945 83127 42805 40809 83614 282 251 533
Sec
School
45516 48661 94177 42923 47308 90231 42817 47648 90465 23 27 50
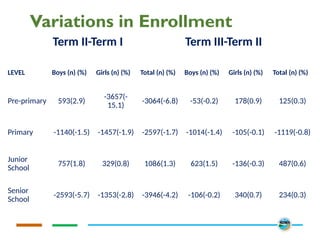
42.
Variations in Enrollment
TermII-Term I Term III-Term II
LEVEL Boys (n) (%) Girls (n) (%) Total (n) (%) Boys (n) (%) Girls (n) (%) Total (n) (%)
Pre-primary 593(2.9)
-3657(-
15.1)
-3064(-6.8) -53(-0.2) 178(0.9) 125(0.3)
Primary -1140(-1.5) -1457(-1.9) -2597(-1.7) -1014(-1.4) -105(-0.1) -1119(-0.8)
Junior
School
757(1.8) 329(0.8) 1086(1.3) 623(1.5) -136(-0.3) 487(0.6)
Senior
School
-2593(-5.7) -1353(-2.8) -3946(-4.2) -106(-0.2) 340(0.7) 234(0.3)
43.
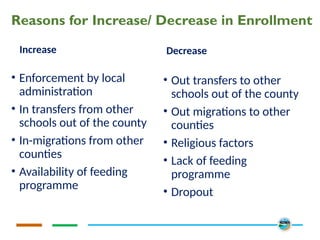
Reasons for Increase/Decrease in Enrollment
Increase
• Enforcement by local
administration
• In transfers from other
schools out of the county
• In-migrations from other
counties
• Availability of feeding
programme
Decrease
• Out transfers to other
schools out of the county
• Out migrations to other
counties
• Religious factors
• Lack of feeding
programme
• Dropout
44.
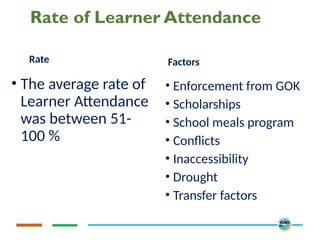
Rate of LearnerAttendance
Rate
• The average rate of
Learner Attendance
was between 51-
100 %
Factors
• Enforcement from GOK
• Scholarships
• School meals program
• Conflicts
• Inaccessibility
• Drought
• Transfer factors
45.
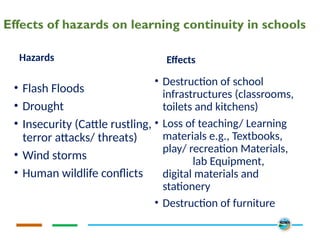
Effects of hazardson learning continuity in schools
Hazards
• Flash Floods
• Drought
• Insecurity (Cattle rustling,
terror attacks/ threats)
• Wind storms
• Human wildlife conflicts
Effects
• Destruction of school
infrastructures (classrooms,
toilets and kitchens)
• Loss of teaching/ Learning
materials e.g., Textbooks,
play/ recreation Materials,
lab Equipment,
digital materials and
stationery
• Destruction of furniture
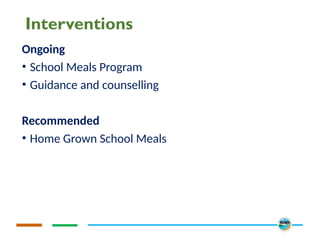
46.
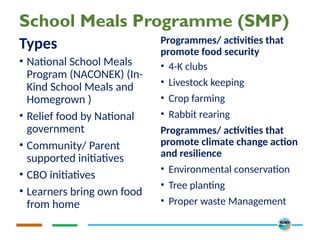
School Meals Programme(SMP)
Types
• National School Meals
Program (NACONEK) (In-
Kind School Meals and
Homegrown )
• Relief food by National
government
• Community/ Parent
supported initiatives
• CBO initiatives
• Learners bring own food
from home
Programmes/ activities that
promote food security
• 4-K clubs
• Livestock keeping
• Crop farming
• Rabbit rearing
Programmes/ activities that
promote climate change action
and resilience
• Environmental conservation
• Tree planting
• Proper waste Management
47.
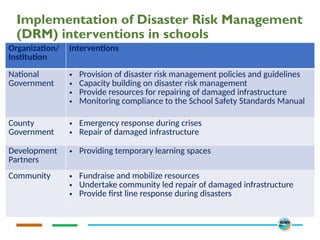
Implementation of DisasterRisk Management
(DRM) interventions in schools
Organization/
Institution
Interventions
National
Government
• Provision of disaster risk management policies and guidelines
• Capacity building on disaster risk management
• Provide resources for repairing of damaged infrastructure
• Monitoring compliance to the School Safety Standards Manual
County
Government
• Emergency response during crises
• Repair of damaged infrastructure
Development
Partners
• Providing temporary learning spaces
Community • Fundraise and mobilize resources
• Undertake community led repair of damaged infrastructure
• Provide first line response during disasters
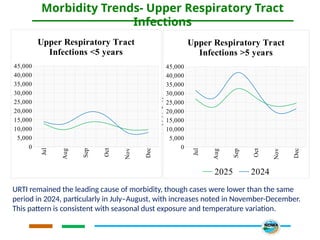
Morbidity Trends- UpperRespiratory Tract
Infections
URTI remained the leading cause of morbidity, though cases were lower than the same
period in 2024, particularly in July–August, with increases noted in November-December.
This pattern is consistent with seasonal dust exposure and temperature variation.
Jul
Aug
Sep
Oct
Nov
Dec
-5,000
5,000
15,000
25,000
35,000
45,000
Upper Respiratory
Tract Infections <5
years
Jul
Aug
Sep
Oct
Nov
Dec
0
10,000
20,000
30,000
40,000
50,000
Upper Respiratory
Tract Infections >5
years
2025 2024
Jul
Aug
Sep
Oct
Nov
Dec
0
5,000
10,000
15,000
20,000
25,000
30,000
35,000
40,000
45,000
Upper Respiratory Tract
Infections <5 years
Jul
Aug
Sep
Oct
Nov
Dec
0
5,000
10,000
15,000
20,000
25,000
30,000
35,000
40,000
45,000
Upper Respiratory Tract
Infections >5 years
2025 2024
51.
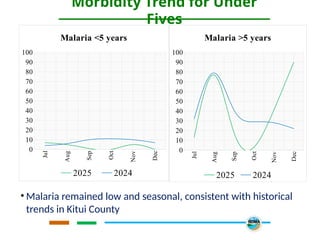
Morbidity Trend forUnder
Fives
• Malaria remained low and seasonal, consistent with historical
trends in Kitui County
Jul
Aug
Sep
Oct
Nov
Dec
0
10
20
30
40
50
60
70
80
90
100
Malaria <5 years
2025 2024
Jul
Aug
Sep
Oct
Nov
Dec
0
10
20
30
40
50
60
70
80
90
100
Malaria >5 years
2025 2024
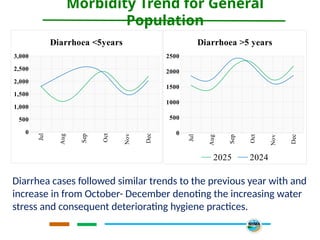
52.
Morbidity Trend forGeneral
Population
Diarrhea cases followed similar trends to the previous year with and
increase in from October- December denoting the increasing water
stress and consequent deteriorating hygiene practices.
Jul
Aug
Sep
Oct
Nov
Dec
0
500
1,000
1,500
2,000
2,500
3,000
Diarrhoea <5years
Jul
Aug
Sep
Oct
Nov
Dec
0
500
1000
1500
2000
2500
Diarrhoea >5 years
2025 2024
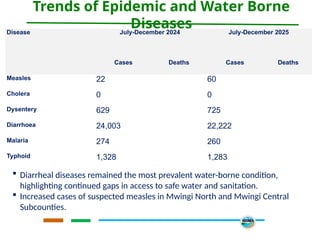
53.
Trends of Epidemicand Water Borne
Diseases
Disease July-December 2024 July-December 2025
Cases Deaths Cases Deaths
Measles 22 60
Cholera 0 0
Dysentery 629 725
Diarrhoea 24,003 22,222
Malaria 274 260
Typhoid 1,328 1,283
Diarrheal diseases remained the most prevalent water-borne condition,
highlighting continued gaps in access to safe water and sanitation.
Increased cases of suspected measles in Mwingi North and Mwingi Central
Subcounties.
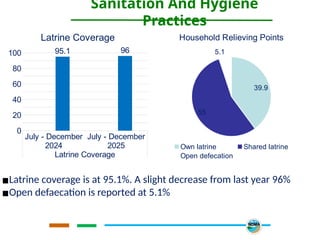
54.
Sanitation And Hygiene
Practices
▪Latrinecoverage is at 95.1%. A slight decrease from last year 96%
▪Open defaecation is reported at 5.1%
July - December
2024
July - December
2025
Latrine Coverage
0
20
40
60
80
100 95.1 96
Latrine Coverage
39.9
55
5.1
Household Relieving Points
Own latrine Shared latrine
Open defecation
55.
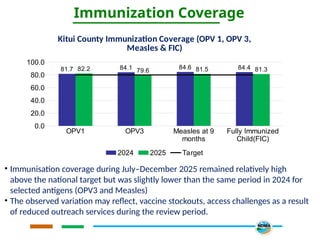
Immunization Coverage
• Immunisationcoverage during July–December 2025 remained relatively high
above the national target but was slightly lower than the same period in 2024 for
selected antigens (OPV3 and Measles)
• The observed variation may reflect, vaccine stockouts, access challenges as a result
of reduced outreach services during the review period.
OPV1 OPV3 Measles at 9
months
Fully Immunized
Child(FIC)
0.0
20.0
40.0
60.0
80.0
100.0
81.7 84.1 84.6 84.4
82.2 79.6 81.5 81.3
Kitui County Immunization Coverage (OPV 1, OPV 3,
Measles & FIC)
2024 2025 Target
56.
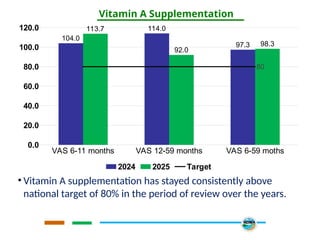
Vitamin A Supplementation
•Vitamin A supplementation has stayed consistently above
national target of 80% in the period of review over the years.
VAS 6-11 months VAS 12-59 months VAS 6-59 moths
0.0
20.0
40.0
60.0
80.0
100.0
120.0
104.0
114.0
97.3
113.7
92.0
98.3
80
2024 2025 Target
57.
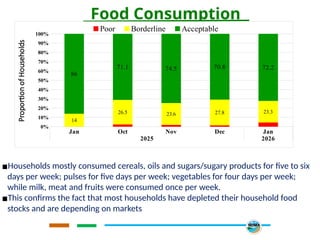
Food Consumption
▪Households mostlyconsumed cereals, oils and sugars/sugary products for five to six
days per week; pulses for five days per week; vegetables for four days per week;
while milk, meat and fruits were consumed once per week.
▪This confirms the fact that most households have depleted their household food
stocks and are depending on markets
Jan Oct Nov Dec Jan
2025 2026
0%
10%
20%
30%
40%
50%
60%
70%
80%
90%
100%
14
26.5 23.6 27.8 23.3
86
71.1 74.5 70.8 72.2
Poor Borderline Acceptable
Proportion
of
Households
58.
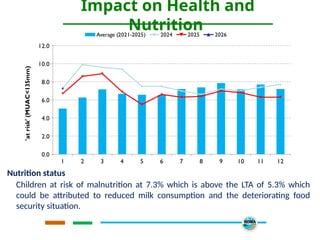
Impact on Healthand
Nutrition
Nutrition status
Children at risk of malnutrition at 7.3% which is above the LTA of 5.3% which
could be attributed to reduced milk consumption and the deteriorating food
security situation.
1 2 3 4 5 6 7 8 9 10 11 12
0.0
2.0
4.0
6.0
8.0
10.0
12.0
Average (2021-2025) 2024 2025 2026
'at
risk'
(MUAC<135mm)
59.
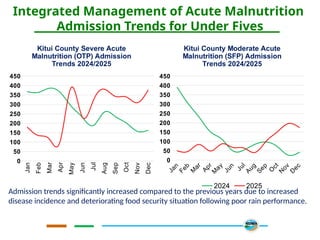
Integrated Management ofAcute Malnutrition
Admission Trends for Under Fives
Admission trends significantly increased compared to the previous years due to increased
disease incidence and deteriorating food security situation following poor rain performance.
Jan
Feb
Mar
Apr
May
Jun
Jul
Aug
Sep
Oct
Nov
Dec
0
50
100
150
200
250
300
350
400
450
Kitui County Severe Acute
Malnutrition (OTP) Admission
Trends 2024/2025
J
a
n
F
e
b
M
a
r
A
p
r
M
a
y
J
u
n
J
u
l
A
u
g
S
e
p
O
c
t
N
o
v
D
e
c
0
50
100
150
200
250
300
350
400
450
Kitui County Moderate Acute
Malnutrition (SFP) Admission
Trends 2024/2025
2024 2025
60.
60
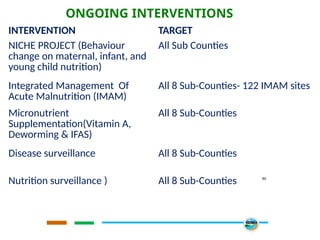
ONGOING INTERVENTIONS
INTERVENTION TARGET
NICHEPROJECT (Behaviour
change on maternal, infant, and
young child nutrition)
All Sub Counties
Integrated Management Of
Acute Malnutrition (IMAM)
All 8 Sub-Counties- 122 IMAM sites
Micronutrient
Supplementation(Vitamin A,
Deworming & IFAS)
All 8 Sub-Counties
Disease surveillance All 8 Sub-Counties
Nutrition surveillance ) All 8 Sub-Counties
61.
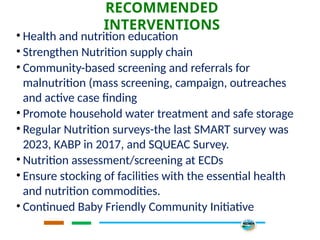
RECOMMENDED
INTERVENTIONS
• Health andnutrition education
• Strengthen Nutrition supply chain
• Community-based screening and referrals for
malnutrition (mass screening, campaign, outreaches
and active case finding
• Promote household water treatment and safe storage
• Regular Nutrition surveys-the last SMART survey was
2023, KABP in 2017, and SQUEAC Survey.
• Nutrition assessment/screening at ECDs
• Ensure stocking of facilities with the essential health
and nutrition commodities.
• Continued Baby Friendly Community Initiative
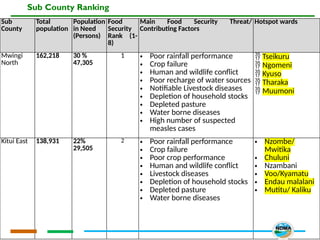
Sub County Ranking
Sub
County
Total
population
Population
inNeed
(Persons)
Food
Security
Rank (1-
8)
Main Food Security Threat/
Contributing Factors
Hotspot wards
Mwingi
North
162,218 30 %
47,305
1 • Poor rainfall performance
• Crop failure
• Human and wildlife conflict
• Poor recharge of water sources
• Notifiable Livestock diseases
• Depletion of household stocks
• Depleted pasture
• Water borne diseases
• High number of suspected
measles cases
Tseikuru
Ngomeni
Kyuso
Tharaka
Muumoni
Kitui East 138,931 22%
29,505
2 • Poor rainfall performance
• Crop failure
• Poor crop performance
• Human and wildlife conflict
• Livestock diseases
• Depletion of household stocks
• Depleted pasture
• Water borne diseases
• Nzombe/
Mwitika
• Chuluni
• Nzambani
• Voo/Kyamatu
• Endau malalani
• Mutitu/ Kaliku
64.
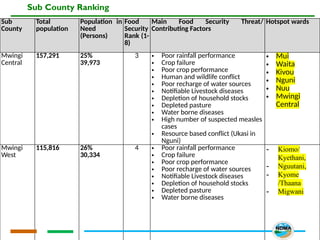
Sub County Ranking
Sub
County
Total
population
Populationin
Need
(Persons)
Food
Security
Rank (1-
8)
Main Food Security Threat/
Contributing Factors
Hotspot wards
Mwingi
Central
157,291 25%
39,973
3 • Poor rainfall performance
• Crop failure
• Poor crop performance
• Human and wildlife conflict
• Poor recharge of water sources
• Notifiable Livestock diseases
• Depletion of household stocks
• Depleted pasture
• Water borne diseases
• High number of suspected measles
cases
• Resource based conflict (Ukasi in
Nguni)
• Mui
• Waita
• Kivou
• Nguni
• Nuu
• Mwingi
Central
Mwingi
West
115,816 26%
30,334
4 • Poor rainfall performance
• Crop failure
• Poor crop performance
• Poor recharge of water sources
• Notifiable Livestock diseases
• Depletion of household stocks
• Depleted pasture
• Water borne diseases
- Kiomo/
Kyethani,
- Nguutani,
- Kyome
/Thaana
- Migwani
65.
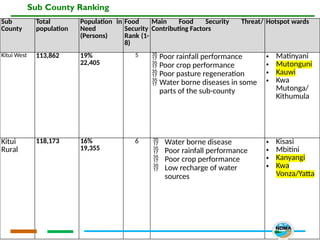
Sub County Ranking
Sub
County
Total
population
Populationin
Need
(Persons)
Food
Security
Rank (1-
8)
Main Food Security Threat/
Contributing Factors
Hotspot wards
Kitui West 113,862 19%
22,405
5 Poor rainfall performance
Poor crop performance
Poor pasture regeneration
Water borne diseases in some
parts of the sub-county
• Matinyani
• Mutonguni
• Kauwi
• Kwa
Mutonga/
Kithumula
Kitui
Rural
118,173 16%
19,355
6 Water borne disease
Poor rainfall performance
Poor crop performance
Low recharge of water
sources
• Kisasi
• Mbitini
• Kanyangi
• Kwa
Vonza/Yatta
66.
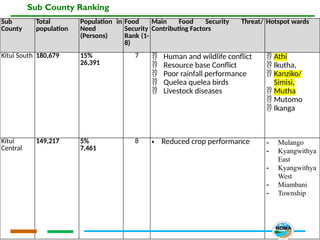
Sub County Ranking
Sub
County
Total
population
Populationin
Need
(Persons)
Food
Security
Rank (1-
8)
Main Food Security Threat/
Contributing Factors
Hotspot wards
Kitui South 180,679 15%
26,391
7 Human and wildlife conflict
Resource base Conflict
Poor rainfall performance
Quelea quelea birds
Livestock diseases
Athi
Ikutha,
Kanziko/
Simisi,
Mutha
Mutomo
Ikanga
Kitui
Central
149,217 5%
7,461
8 • Reduced crop performance - Mulango
- Kyangwithya
East
- Kyangwithya
West
- Miambani
- Township
67.
Factors to Monitor
OND 2025 Rainfall Performance
Household food stocks
Insecurity/Conflicts
Incidences of livestock pests/ diseases and mortalities
Human wildlife conflicts
Food prices
Malnutrition trends
Human diseases outbreak
Crop pests and diseases